
remote research director dashboard software components
[ components related to data collection ]
[ tracking your data collection efforts ]
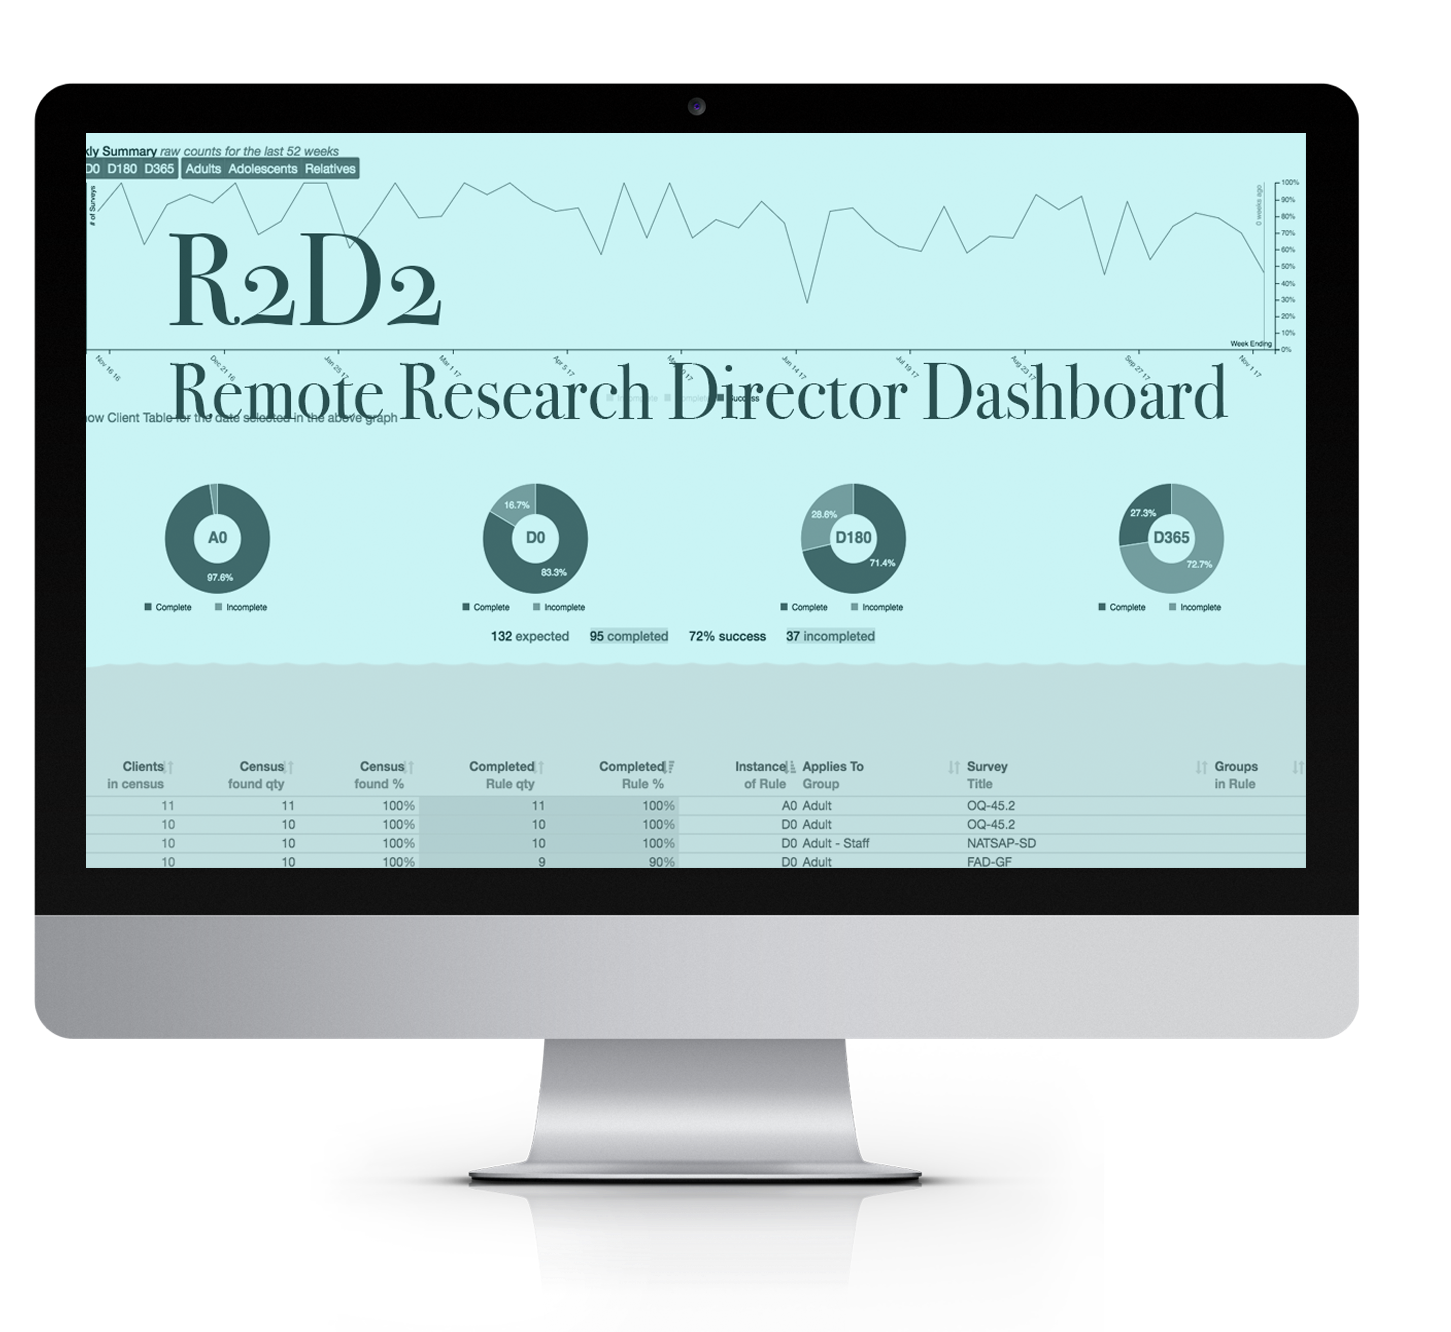
There’s an entire dashboard that shows you how well you are doing at meeting your data collection goals.
- o1_Auto-Prioritized Task List
- o2_Simple Charts Show Data Collection Success
- o3_Email Templates and Texts for Customized Follow-up
There’s an entire dashboard that shows you how well you are doing at meeting your data collection goals.
- o1_Auto-Prioritized Task List
- o2_Simple Charts Show Data Collection Success
- o3_Email Templates and Texts for Customized Follow-up
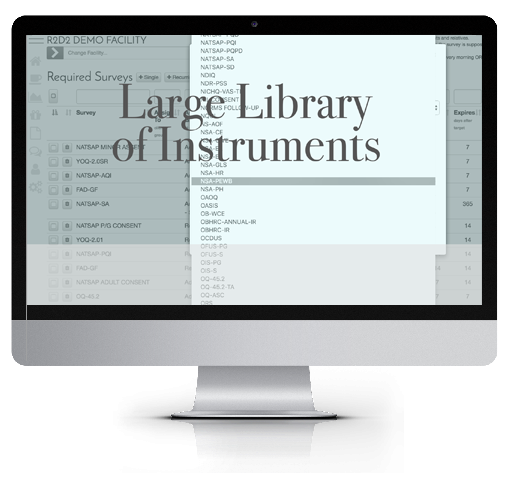
[ large library of instruments ]
You have access to both open source and subscription-based normed and valid surveys. We’ll help you pick the right ones if you don’t already know.
- o1_We've Been Working With Survey Vendors For Years
- o2_We'll Help You Figure Out Which Tools Are Right For You
You have access to both open source and subscription-based normed and valid surveys. We’ll help you pick the right ones if you don’t already know.
- o1_We've Been Working With Survey Vendors For Years
- o2_We'll Help You Figure Out Which Tools Are Right For You
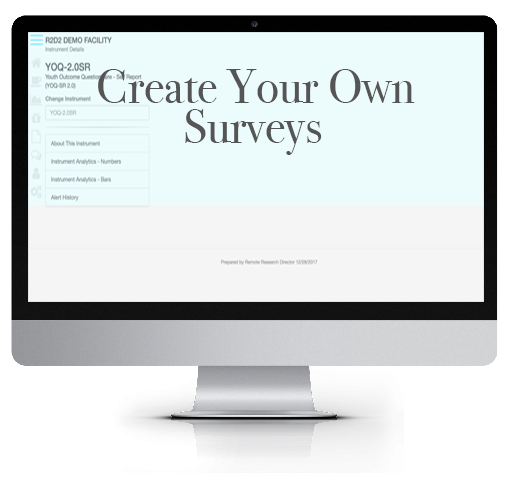
[ custom survey creation ]
In addition to our large library of instruments you can create your own surveys.
- o1_We Usually Recommend Building Your Own Surveys To Compliment Normed And Valid Data Collection.
- o2_Let Us Help You To Design A Custom Survey!
In addition to our large library of instruments you can create your own surveys.
- o1_We Usually Recommend Building Your Own Surveys To Compliment Normed And Valid Data Collection.
- o2_Let Us Help You To Design A Custom Survey!
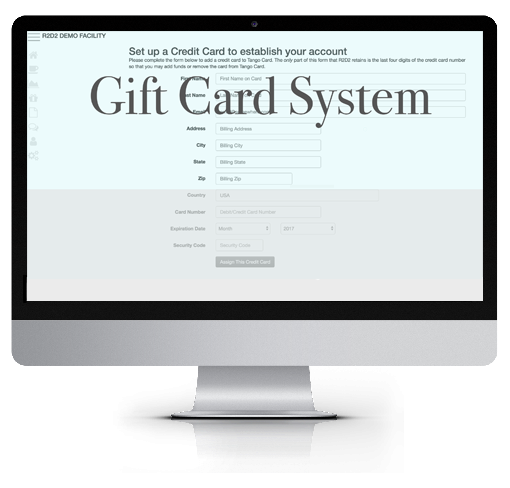
[ integrated gift card system ]
If you’ve tried, you know it’s really tough to get feedback from alumni. With this system you set the rules, fund the account, and gift cards are emailed and/or texted to qualified recipients.
- o1_Collecting Data After Clients Have Returned Home Is Always A Challenge.
- o2_The Gift Card Can Be An Appropriate Tool To Increase Your Post Discharge Response Rates.
[ components related to clinical progress and outcomes ]
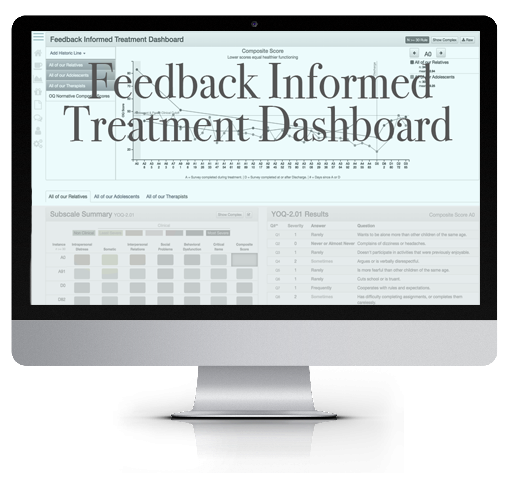
[ feedback informed treatment dashboard]
The FIT Dash is possibly our most powerful tool. It allows easy viewing of client progress via line graph and tables.
- o1_See client progress in graphs and tables.
- o2_Push-button sorting allows quick access to important items and sub scales.
- o3_Overlay results from other people like parents or therapists.
- o4_Compare how one client is doing in relationship to everyone else.
- o5_Mark any event on timeline.
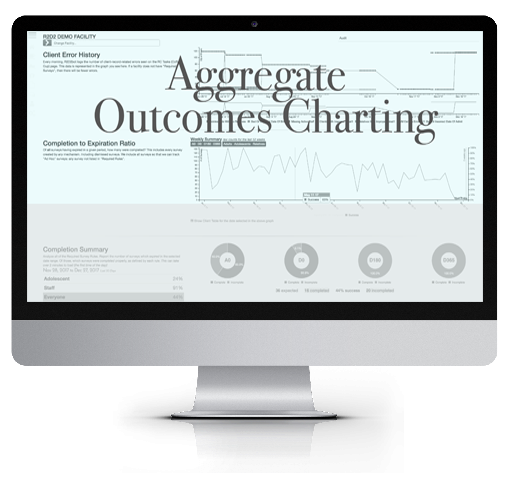
[ aggregate outcomes charting ]
You can see your overall outcome averages, compare different date ranges and save your results so that you can share them with stakeholders.
- o1_Look at your program’s average outcomes.
- o2_Date range options allow easy comparisons over time.
- o3_Save your charts to an html file so that you can email it to stakeholders.
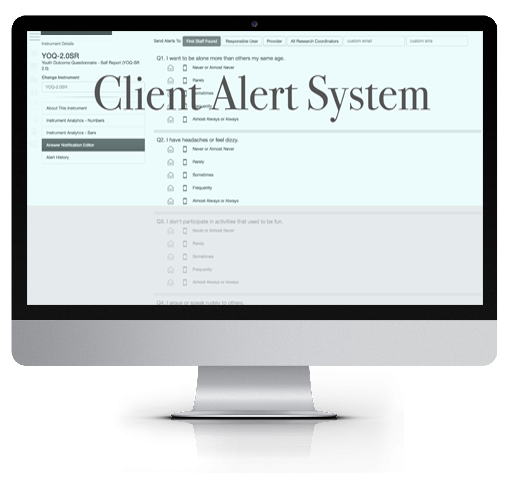
[ automated client alert system ]
Staying on top of critical items is important for client health and reducing risk:
- o1_Choose alerts by item for any survey.
- o2_Get secure messages on the spot.
Staying on top of critical items is important for client health and reducing risk:
- o1_Choose alerts by item for any survey.
- o2_Get secure messages on the spot.
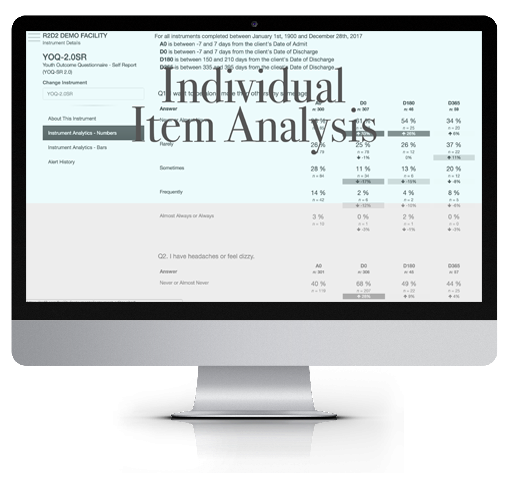
[ individual item analysis ]
As long as a survey item has a score you can choose up to 8 date ranges for comparison.
- o1_Perfect for customer satisfaction surveys.
- o2_Find out if your outcomes, overall, are getting better or worse from quarter to quarter.
- o3_Find those items that show the greatest improvement for marketing materials.